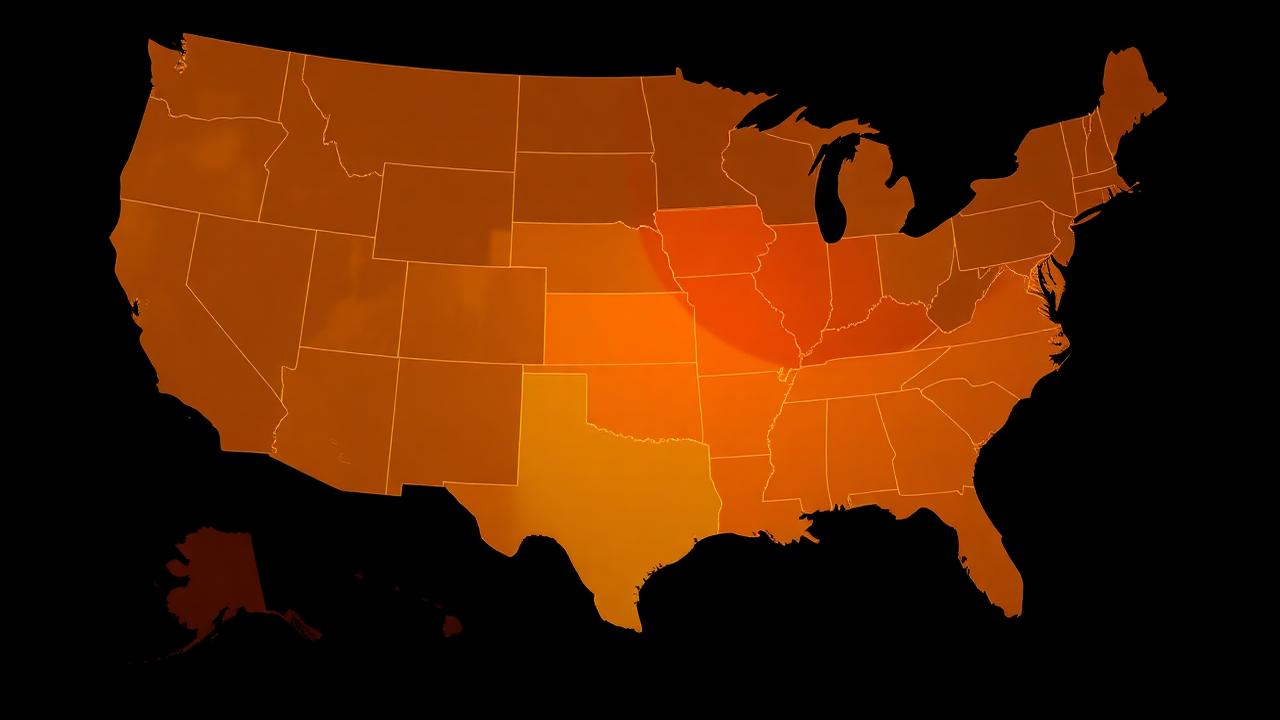
What a tornado probability actually means
When you see a "10% tornado" on an SPC Day 1 outlook, that number has a precise definition: the probability of a tornado occurring within 25 miles of any point inside the contoured area, during the valid forecast period.
That's not the probability of a tornado happening somewhere in the outlook. That's the probability for any single point inside the 10% line. The distinction matters, because it explains why a "5%" can still produce a multi-tornado day and why a "30%" is genuinely a major event.
The standard probability values
SPC uses a fixed set of probability contours so chasers and forecasters always know exactly what each number means:
| Tornado % | What it tells you |
|---|---|
| 2% | Marginal; isolated brief tornadoes possible |
| 5% | Slight Risk equivalent; scattered tornadoes possible |
| 10% | Enhanced Risk equivalent; tornadoes likely somewhere in the area |
| 15% | Moderate Risk equivalent; significant tornado threat |
| 30% | High Risk equivalent; outbreak-level |
| 45% / 60% | Extreme high-end outbreak days; very rare |
What "hatched" means on the probability map
A hatched area on the tornado probability map means significant tornadoes (EF2 or stronger) are possible within 25 miles of any point inside the hatching. This is the single most important symbol on the entire Day 1 graphic.
Hatching is independent of the probability value. You can have:
- A 5% hatched area (low chance of any tornado, but if one occurs it could be significant)
- A 10% non-hatched area (tornadoes likely but generally lower-end)
- A 15% hatched area (significant tornado threat — almost always a major chase day)
For photogenic, chaseable tornadoes, hatched 10%+ areas are the bullseye.
Why "5%" is more important than people think
A 5% probability sounds small, but applied to a 50,000 square-mile area, it implies a meaningful expected number of tornadoes — typically 1–3 confirmed touchdowns. The 5% line is also where SPC starts considering Slight Risk language in the categorical outlook.
Many destructive tornadoes have happened inside 5% hatched areas. The number is not a yes/no signal — it's a probability density.
What "30%" actually feels like
30% probability days are rare — usually a handful per year. They represent outbreak-level setups where multiple long-track significant tornadoes are likely. Some examples:
- April 27, 2011 (Super Outbreak) — 30% hatched across multiple states
- May 20, 2013 (Moore) — 30% hatched centered over central Oklahoma
- April 14, 2012 (Wichita area) — 30% hatched
If you see a 30% hatched, treat it as a national-news-tier event, not a normal chase day.
How probability evolves through the day
Tornado probabilities are updated with the rest of the Day 1 outlook (0600, 1300, 1630, 2000, 0100 UTC). Watch how they evolve:
- Upgrade in probability (5 → 10, 10 → 15) = forecasters more confident
- Hatching added = significant tornado threat now considered
- Geographic shift = focus moving with the surface features
- Categorical upgrade to follow = larger structural change in the forecast
When probabilities change between updates, that change is often more informative than the new number itself.
The verification angle
These probabilities are not gut-feel — they are calibrated against decades of verification. When SPC issues a 10% tornado area, historically a real tornado occurs within 25 miles of any point in that area 10% of the time. The calibration is one of the reasons SPC's products are respected globally.
If you want to dig in, the SPC verification page publishes detailed performance statistics every season.
How chasers use probability maps
- Look at the tornado probability map first — before the categorical risk.
- Find any hatched areas.
- Note the maximum probability inside the hatching (5, 10, 15, 30).
- Cross-reference with the surface analysis to find the driver (dryline, warm front, triple point).
- Pick a target on or just east of the hatching.
Common mistakes
- Treating probabilities as yes/no. A 5% area can still produce a tornado day.
- Ignoring hatching. A 5% hatched is more dangerous than a 10% non-hatched.
- Reading only the categorical. Categorical risk is a summary; the probability map is the precision.
- Underestimating geographic precision. "Within 25 miles of any point" is a meaningful precision floor — these aren't statewide probabilities.
How Meso uses probability data
Meso pulls SPC tornado, wind, and hail probability fields with hatching and surfaces them as part of "Where should I go today?" — one of the eight core chaser questions. When probabilities change between outlook updates — say, a 5% hatched gets upgraded to 10% hatched centered on your target — Meso flags the change under "Did anything important just change?" so you don't miss a major update while you're driving. The official SPC numbers are always shown explicitly, never reinterpreted or "AI-enhanced," because the SPC calibration is exactly what you want to trust.